
Duplex printing in Crystal Reports
Duplex printing is dependent on the type of printer you have. You must verify that your printer supports duplex printing. Crystal Reports does not control a printer's duplex printing ability. The printer driver for the printer handles the duplex print control. In order to print in duplex mode you must verify the following:
• The duplex printer must be set as the default printer in Windows.
• The report must have the default printer selected in the Printer Setup dialog in Crystal Reports.
Printing subreports in different formats
In Crystal Reports, you can format the main report and subreport to print in either Portrait or Landscape orientation. This is because the subreports are considered part of the main report and maintain formatting of the main report. Therefore, individual landscape or portrait page formatting cannot be set and only portrait or landscape formatting can be set for the entire report.
Printing is slow when using a dot matrix printer
When printing in Crystal Reports a virtual page (virtual picture) is generated. Therefore, when printing to a dot matrix printer the printing speed is very slow. A dot matrix printer will take longer to print a picture type file. Therefore, the suggested workaround is to export the report to text format and print the exported file.
It is also possible to apply Text Mode settings to a dot matrix printer to improve printing speed. Printing in Graphics Mode can result in a better quality print out, however the printing speed is slower.
Showing posts with label Crystal Reports. Show all posts
Showing posts with label Crystal Reports. Show all posts
Tuesday, January 8, 2013
Design considerations in Crystal Reports

Listed below are several design hints for creating reports that will be shared with other people.
Correctly spacing text objects
Ensure each field object is a little bit larger than the maximum value it will displayed. This will avoid values being truncated.
Placing text objects close to other objects
As previously discussed, a text object’s boundary will not expand at runtime. If the printer driver being used prints fonts wider, the text could be truncated. A solution is to expand the width of the text-based object to accommodate this possible growth. While this is an effective solution, it does require some design considerations when placing text-based objects close to other objects.
Consider the following example:
A second object is placed to the immediate right of a text object. In order to accommodate possible growth, the text object on the left is expanded so that its expanded boundary is now overlapping the boundary of the second object. The report is printed and everything looks correct. It is then printed using another printer driver that causes the text to print wider. Although the first object’s boundary was made wider to accommodate the variance in text width, the two objects’ physical starting points (their X coordinates) do not change. Thus, a situation could exist where the text from the object on the left could print over top of the second object on the right. The same situation could exist when creating a columnar type report, where lines separate the columns. In this situation, the text could potentially print on top of, and outside of, the lines.
It is generally advisable to avoid designing distributed reports where the space between objects is very tight. Leave room for expandability and expand the text objects’ width by approximately 5%. An alternative is to consider reducing the size of the font.
Placing multi-line text objects
Consider where and how you place multi-line text-based objects. You could encounter problems if you have other objects in the same section placed directly below an object formatted to print on multiple lines. For example, on the development PC, a multi-line text-based object is placed on the first line of a section. Since the text object normally never requires more than three lines to print, the developer places another object on line four of the section. Since a different printer driver could measure the font wider and cause the multi-line object to require an additional line, the object on the fourth line is now in danger of being over printed with the last line of the multi-line text object.
So, wherever possible, place multi-line text-based objects at the bottom of the section. If they require more lines to print, the section will simply expand to accommodate the growth.
Using TrueType fonts
Designing your report using printer-specific fonts may lead to problems when printing to other printers. The fonts may not be supported by other printers. If they are supported, they may not be installed on other printers. If this occurs, Crystal Reports will have to make a font substitution that could create inconsistent results. It is recommended that only common TrueType fonts be used. Common True Type fonts include Arial and Times New Roman.
Using the most common video resolution
If you have two identical printers, two identical printer drivers and two identical operating systems but the resolution of the video driver is different, the paging of Windows documents will be different. It is recommended that you set your video resolution to the most common video resolution. If a document is designed with the video set to a resolution of 1024 X 780 pixels and is then printed on another PC where the video resolution is coarser (such as 800 X 600 pixels), the document will encounter more formatting changes than if it was developed on 800 X 600 and moved to a finer screen resolution. Developing reports with your video resolution set at the most common and coarsest resolution will ensure that your reports will be the least sensitive to video driver settings. Unfortunately, there is no way to design Windows documents to be immune to changing video driver resolutions.
Setting specific margins
Crystal Reports has the option of setting specific margins or using the printer’s default margins. If you use the default margins and then print in another environment where the printer’s default margins are greater and provide a smaller printable area, the report objects on the right size of the report will print off the page and will be truncated. It is recommended that you always set your own margins. As soon as you do so, the check box to Use Default Margins (click Page Setup from the File menu) will be cleared. If the margins you want to use are the same as your default margins, make sure that you clear this check box:
1. On the File menu, select Page Setup.
2. Clear the Use Default Margins check box. Click OK.
Changing the paper orientation
To change the default printing option from portrait to landscape:
In Crystal Reports XI Release 1 and Release 2:
Select Page Setup from the File menu. From the Page Setup dialog box select Landscape.
In Crystal Reports 10 and lower:
Select Printer Setup from the File menu. From the Printer Setup dialog box select Landscape.
Note that this option will only appear if the printer is capable of printing in both portrait and landscape modes. Changing the default printing option from portrait to landscape will not change the default margins or user defined margins used by the printer. The option will change only for the particular report.
Choosing the default printer (Crystal Reports 10 and lower)
In general, it is recommended that you do not choose a specific printer. While doing so will not impair Crystal Reports, it might result in complications due to the many different ways that printers are recognized on different versions of Windows.
For example, suppose an HP Laser III printer is installed on three different operating systems.
• With Windows 95, the printer name can be changed so that HP Laser III is now “Front Reception Printer”; however, the printer driver will be listed as Hppc15ms.drv.
• With Windows NT, the printer name is also referenced and can be changed by the user but the printer driver is always winspool.
• If you specify a specific printer, Crystal Reports will be looking for that printer by name. If the specific printer you specify does not exist, the default printer will be chosen. If you need to specify a specific printer, such as a label printer or a printer dedicated to printing invoices, the printer name must be the same as the machine the report was designed on. If your report is part of a distributed application, you can:
• Provide your users with a Select Printer dialog box so that they can choose the correct printer, or;
• Give the specific printer on the development machine the same name, as it would have on other computers – that is, the name of the actual printer chosen.
Continuing with the above example, you would name the printer “HP Laser III”. In this way, all clients using the same specific printer in Windows 3.X environments will be named the same (HP Laser III) and the specific printer will print the report.
For Windows clients, simply rename the printer (“Front Reception Printer”) back to “HP Laser III” or set up an identical printer with the correct default name.
If you must use a specific printer with a specific name, be aware that all your clients must have the same printer or they could encounter problems.
Maintaining default printer settings (Crystal Reports 10 and lower)
If the Default Properties option is selected it allows the default printer properties to be used as it is set in the Windows Control Panel. To select the Default Properties in Crystal Reports, complete the following:
1. From the File menu, select Printer Setup.
2. Select Default Properties from the Print Setup dialog box.
Making modifications to the properties in the printer setup dialog box will cause the default properties option to become cleared.
Selecting Free Form Placement for all sections
In order to create dynamic reports and reduce printer driver dependency as much as possible, it is recommended that all sections of the reports be formatted with Free Form Placement selected (in Crystal Reports XI Release 2 this isn’t an option anymore, it is always in Free Form Placement).
Correctly spacing text objects
Ensure each field object is a little bit larger than the maximum value it will displayed. This will avoid values being truncated.
Placing text objects close to other objects
As previously discussed, a text object’s boundary will not expand at runtime. If the printer driver being used prints fonts wider, the text could be truncated. A solution is to expand the width of the text-based object to accommodate this possible growth. While this is an effective solution, it does require some design considerations when placing text-based objects close to other objects.
Consider the following example:
A second object is placed to the immediate right of a text object. In order to accommodate possible growth, the text object on the left is expanded so that its expanded boundary is now overlapping the boundary of the second object. The report is printed and everything looks correct. It is then printed using another printer driver that causes the text to print wider. Although the first object’s boundary was made wider to accommodate the variance in text width, the two objects’ physical starting points (their X coordinates) do not change. Thus, a situation could exist where the text from the object on the left could print over top of the second object on the right. The same situation could exist when creating a columnar type report, where lines separate the columns. In this situation, the text could potentially print on top of, and outside of, the lines.
It is generally advisable to avoid designing distributed reports where the space between objects is very tight. Leave room for expandability and expand the text objects’ width by approximately 5%. An alternative is to consider reducing the size of the font.
Placing multi-line text objects
Consider where and how you place multi-line text-based objects. You could encounter problems if you have other objects in the same section placed directly below an object formatted to print on multiple lines. For example, on the development PC, a multi-line text-based object is placed on the first line of a section. Since the text object normally never requires more than three lines to print, the developer places another object on line four of the section. Since a different printer driver could measure the font wider and cause the multi-line object to require an additional line, the object on the fourth line is now in danger of being over printed with the last line of the multi-line text object.
So, wherever possible, place multi-line text-based objects at the bottom of the section. If they require more lines to print, the section will simply expand to accommodate the growth.
Using TrueType fonts
Designing your report using printer-specific fonts may lead to problems when printing to other printers. The fonts may not be supported by other printers. If they are supported, they may not be installed on other printers. If this occurs, Crystal Reports will have to make a font substitution that could create inconsistent results. It is recommended that only common TrueType fonts be used. Common True Type fonts include Arial and Times New Roman.
Using the most common video resolution
If you have two identical printers, two identical printer drivers and two identical operating systems but the resolution of the video driver is different, the paging of Windows documents will be different. It is recommended that you set your video resolution to the most common video resolution. If a document is designed with the video set to a resolution of 1024 X 780 pixels and is then printed on another PC where the video resolution is coarser (such as 800 X 600 pixels), the document will encounter more formatting changes than if it was developed on 800 X 600 and moved to a finer screen resolution. Developing reports with your video resolution set at the most common and coarsest resolution will ensure that your reports will be the least sensitive to video driver settings. Unfortunately, there is no way to design Windows documents to be immune to changing video driver resolutions.
Setting specific margins
Crystal Reports has the option of setting specific margins or using the printer’s default margins. If you use the default margins and then print in another environment where the printer’s default margins are greater and provide a smaller printable area, the report objects on the right size of the report will print off the page and will be truncated. It is recommended that you always set your own margins. As soon as you do so, the check box to Use Default Margins (click Page Setup from the File menu) will be cleared. If the margins you want to use are the same as your default margins, make sure that you clear this check box:
1. On the File menu, select Page Setup.
2. Clear the Use Default Margins check box. Click OK.
Changing the paper orientation
To change the default printing option from portrait to landscape:
In Crystal Reports XI Release 1 and Release 2:
Select Page Setup from the File menu. From the Page Setup dialog box select Landscape.
In Crystal Reports 10 and lower:
Select Printer Setup from the File menu. From the Printer Setup dialog box select Landscape.
Note that this option will only appear if the printer is capable of printing in both portrait and landscape modes. Changing the default printing option from portrait to landscape will not change the default margins or user defined margins used by the printer. The option will change only for the particular report.
Choosing the default printer (Crystal Reports 10 and lower)
In general, it is recommended that you do not choose a specific printer. While doing so will not impair Crystal Reports, it might result in complications due to the many different ways that printers are recognized on different versions of Windows.
For example, suppose an HP Laser III printer is installed on three different operating systems.
• With Windows 95, the printer name can be changed so that HP Laser III is now “Front Reception Printer”; however, the printer driver will be listed as Hppc15ms.drv.
• With Windows NT, the printer name is also referenced and can be changed by the user but the printer driver is always winspool.
• If you specify a specific printer, Crystal Reports will be looking for that printer by name. If the specific printer you specify does not exist, the default printer will be chosen. If you need to specify a specific printer, such as a label printer or a printer dedicated to printing invoices, the printer name must be the same as the machine the report was designed on. If your report is part of a distributed application, you can:
• Provide your users with a Select Printer dialog box so that they can choose the correct printer, or;
• Give the specific printer on the development machine the same name, as it would have on other computers – that is, the name of the actual printer chosen.
Continuing with the above example, you would name the printer “HP Laser III”. In this way, all clients using the same specific printer in Windows 3.X environments will be named the same (HP Laser III) and the specific printer will print the report.
For Windows clients, simply rename the printer (“Front Reception Printer”) back to “HP Laser III” or set up an identical printer with the correct default name.
If you must use a specific printer with a specific name, be aware that all your clients must have the same printer or they could encounter problems.
Maintaining default printer settings (Crystal Reports 10 and lower)
If the Default Properties option is selected it allows the default printer properties to be used as it is set in the Windows Control Panel. To select the Default Properties in Crystal Reports, complete the following:
1. From the File menu, select Printer Setup.
2. Select Default Properties from the Print Setup dialog box.
Making modifications to the properties in the printer setup dialog box will cause the default properties option to become cleared.
Selecting Free Form Placement for all sections
In order to create dynamic reports and reduce printer driver dependency as much as possible, it is recommended that all sections of the reports be formatted with Free Form Placement selected (in Crystal Reports XI Release 2 this isn’t an option anymore, it is always in Free Form Placement).
Using grids and guidelines in Crystal Reports

Each section of a report contains a design grid. The grid always exists; however, Crystal Reports allows you to determine if the grid is visible or not and allows you to establish a grid size (how far each increment is apart).
1. On the File menu, select Options.
2. The Grid Options is located under the Layout tab.
The check boxes allow you to show the grid in Design and/or Preview mode. You can also set the grid size.
For example, setting the grid size to .167 will give you six grid lines per inch. The grid size is the same for all sections. The grid is measured from the upper left-hand corner of each section and continues down, and to the right, until the end of the section. A new grid of the same size then begins from the upper left-hand corner of the next section. This continues throughout the entire report.
The Options dialog box also gives you the option of selecting or clearing Snap to Grid. When you select Snap to Grid, the upper left corner of all newly placed text-based and OLE objects’ boundaries will snap to each grid point. Objects placed before selecting Snap to Grid will not move to snap to the nearest grid point. They will remain where they are. If you resize an object, the side(s) that you are resizing snap to the closest grid point. If you have several text objects of different font sizes snapped to the same vertical grid point, the base of the text will not line up because it is the object’s upper left corner that snaps to the grid. The height of the text object and the distance from the top border to the text’s baseline is determined by the size of the font.
In the example below, Free Form Placement and Snap to Grid are both selected.
CUSTNUM
This field is placed on the report and then the font size is increased. Notice that the upper left boundary (indicated by the corner crop marking) is snaps to the grid point while the other three corners are not. The text-based object increases in size to accommodate the new font size.
CONAME
This field is placed on the report and then the right border is moved. Notice that both the left and right boundaries are now snapped to a grid point.
STATE
This field is inserted and then the bottom boundary is dragged down. Notice that the bottom boundary also snaps to the grid line but the font size does not change.
1. On the File menu, select Options.
2. The Grid Options is located under the Layout tab.
The check boxes allow you to show the grid in Design and/or Preview mode. You can also set the grid size.
For example, setting the grid size to .167 will give you six grid lines per inch. The grid size is the same for all sections. The grid is measured from the upper left-hand corner of each section and continues down, and to the right, until the end of the section. A new grid of the same size then begins from the upper left-hand corner of the next section. This continues throughout the entire report.
The Options dialog box also gives you the option of selecting or clearing Snap to Grid. When you select Snap to Grid, the upper left corner of all newly placed text-based and OLE objects’ boundaries will snap to each grid point. Objects placed before selecting Snap to Grid will not move to snap to the nearest grid point. They will remain where they are. If you resize an object, the side(s) that you are resizing snap to the closest grid point. If you have several text objects of different font sizes snapped to the same vertical grid point, the base of the text will not line up because it is the object’s upper left corner that snaps to the grid. The height of the text object and the distance from the top border to the text’s baseline is determined by the size of the font.
In the example below, Free Form Placement and Snap to Grid are both selected.

CUSTNUM
This field is placed on the report and then the font size is increased. Notice that the upper left boundary (indicated by the corner crop marking) is snaps to the grid point while the other three corners are not. The text-based object increases in size to accommodate the new font size.
CONAME
This field is placed on the report and then the right border is moved. Notice that both the left and right boundaries are now snapped to a grid point.
STATE
This field is inserted and then the bottom boundary is dragged down. Notice that the bottom boundary also snaps to the grid line but the font size does not change.
CITY
This field is simply placed on the report. The boundary’s upper left corner snaps to a grid point.
COUNTRY
This field is placed on the report when Snap to Grid is not selected. Notice that the object does not move and its boundaries do not snap to any grid point.
Notice that while the CUSTNUM, CONAME and STATE fields are snapped to the same horizontal grid line, the bases of the three fonts do not line up.
Also notice the grid in the top section with the five fields. The section consists of three full grid lines and a partial fourth. Even though the fourth grid line is not visible, the section below starts with a new grid with the sections upper left corner as (0,0).
Guidelines are used to help you line up objects. They have a snap property that automatically snaps objects to them. That is, objects will connect to the guidelines as positioning devices. An OLE object can snap to a horizontal guideline on its top, bottom, or horizontal midline (the invisible line that bisects the object horizontally). However, the snap property of guidelines is different for text-based objects. When a text-based object snaps to a guideline, it is the baseline of the text and not the boundary of the object that snaps to the guideline. You can see a red tick in the left and right object border where the baseline is. Thus, if you need to place several text objects of different font sizes on one line and have their baselines line up, you will want to snap them to a guideline.
If you have selected Snap to Grid and you want to position text objects of different font sizes so that their baselines line up:
1. First insert a guideline. The guideline will snap to the grid line when it is placed.
2. Snap the text-based objects to the guideline.
NOTE
When placing text-based objects, snapping to a guideline takes precedence over snapping to a grid line. However, if you later resize the text object’s height, the text object will snap the boundary being resized to the closest grid line.

In the example above, when CONTACTLN is first inserted, its baseline snaps to the guideline. When the upper border is then resized by dragging the object’s upper border upwards, the object assumes the characteristics of Snap to Grid. When PHONE is first inserted, its baseline also snaps to the guideline. However, when it is resized by dragging the bottom boundary downward, the object expands but the precedence of the text snapping to the guideline, instead of the grid line, is maintained.
Becoming familiar with the properties and functionality of grid lines and guidelines and working with the two requires some experimentation. It is important to note that selecting/clearing Snap to Grid and/or using guidelines or not, is a matter of selecting the best methodology for positioning the objects in your report exactly where you want them to be. Also remember that if you have Free Form Placement cleared (binding the section to lines) and you select Snap to Grid, all objects will snap to the guidelines for vertical placement and the left boundary will snap to both vertical guidelines and grid points.
This field is simply placed on the report. The boundary’s upper left corner snaps to a grid point.
COUNTRY
This field is placed on the report when Snap to Grid is not selected. Notice that the object does not move and its boundaries do not snap to any grid point.
Notice that while the CUSTNUM, CONAME and STATE fields are snapped to the same horizontal grid line, the bases of the three fonts do not line up.
Also notice the grid in the top section with the five fields. The section consists of three full grid lines and a partial fourth. Even though the fourth grid line is not visible, the section below starts with a new grid with the sections upper left corner as (0,0).
Guidelines are used to help you line up objects. They have a snap property that automatically snaps objects to them. That is, objects will connect to the guidelines as positioning devices. An OLE object can snap to a horizontal guideline on its top, bottom, or horizontal midline (the invisible line that bisects the object horizontally). However, the snap property of guidelines is different for text-based objects. When a text-based object snaps to a guideline, it is the baseline of the text and not the boundary of the object that snaps to the guideline. You can see a red tick in the left and right object border where the baseline is. Thus, if you need to place several text objects of different font sizes on one line and have their baselines line up, you will want to snap them to a guideline.
If you have selected Snap to Grid and you want to position text objects of different font sizes so that their baselines line up:
1. First insert a guideline. The guideline will snap to the grid line when it is placed.
2. Snap the text-based objects to the guideline.
NOTE
When placing text-based objects, snapping to a guideline takes precedence over snapping to a grid line. However, if you later resize the text object’s height, the text object will snap the boundary being resized to the closest grid line.

In the example above, when CONTACTLN is first inserted, its baseline snaps to the guideline. When the upper border is then resized by dragging the object’s upper border upwards, the object assumes the characteristics of Snap to Grid. When PHONE is first inserted, its baseline also snaps to the guideline. However, when it is resized by dragging the bottom boundary downward, the object expands but the precedence of the text snapping to the guideline, instead of the grid line, is maintained.
Becoming familiar with the properties and functionality of grid lines and guidelines and working with the two requires some experimentation. It is important to note that selecting/clearing Snap to Grid and/or using guidelines or not, is a matter of selecting the best methodology for positioning the objects in your report exactly where you want them to be. Also remember that if you have Free Form Placement cleared (binding the section to lines) and you select Snap to Grid, all objects will snap to the guidelines for vertical placement and the left boundary will snap to both vertical guidelines and grid points.
Characteristics of report sections in Crystal Reports

In all versions of Crystal Reports, a report consists of several sections such as the Page Header, Group Header, Details, Group Footer and Page Footer. In versions of Crystal Reports prior to version 5.0, all sections consist of complete lines; complete in that a section will never consist of a half line (for example, four lines and never four and a half).
In a new report, each section consists of at least one line. The default fonts for Fields and Text Objects determine the line’s height:
1. On the File menu, click Options.
2. Click the Fonts tab. You will see command buttons labeled Fields, Summary Fields, Group Name Fields, Text Objects and Field Titles.
When a text-based object is placed on a line, the line’s height is adjusted up or down so that the line is now high enough to accommodate that text-based object. If another text-based object is placed on the same line and its font size is larger than the first, the line’s height is again adjusted to accommodate the second text-based object. Thus, the text-based object determines a line’s height with largest font on the line. All text-based
Objects are positioned on a line so that their base lines will all line up on any given line. This means that a text-based object cannot be placed between lines; it must be placed on a line. Consequently, in versions of Crystal Reports prior to version 5.0, all text-based objects are bound to lines.
The screen shots above are from Crystal Reports version 8.5. The image on the left shows the Detail section with no objects inserted and a default line height of 12 points. When a database field is first placed on the report (center image), the line’s height does not change because it is the default line height (12 points). If the text-based object’s font size is increased from 12 to 16 points, the actual height of the object (boundary) increases.
If the line height increases to accommodate the larger text-based object, then the base lines of the two dissimilar font sizes will print on different lines. This is seen in the image on the right. If a second text-based object is placed on the same line as the larger 12-point object and the smaller font object’s height (boundary) matches that of the larger font, the baselines of the two dissimilar font sizes will match, thus printing on the same line.
As other text-based objects are added to the report, either by adding lines to the same section or by placing them in other sections, the vertical spacing or interline spacing, while controlled by Crystal Reports, is determined by the printer driver. Remember, the text metrics of a font determine interline spacing. This functionality makes it difficult to create reports designed to print on preprinted forms if the printer driver is going to change. For example, totals that used to print in the middle of a box might now print below the box because the new printer driver applies a greater value to interline spacing. Line by line, the text in the report will move down farther than when the report was first created.
In a new report, each section consists of at least one line. The default fonts for Fields and Text Objects determine the line’s height:
1. On the File menu, click Options.
2. Click the Fonts tab. You will see command buttons labeled Fields, Summary Fields, Group Name Fields, Text Objects and Field Titles.
When a text-based object is placed on a line, the line’s height is adjusted up or down so that the line is now high enough to accommodate that text-based object. If another text-based object is placed on the same line and its font size is larger than the first, the line’s height is again adjusted to accommodate the second text-based object. Thus, the text-based object determines a line’s height with largest font on the line. All text-based
Objects are positioned on a line so that their base lines will all line up on any given line. This means that a text-based object cannot be placed between lines; it must be placed on a line. Consequently, in versions of Crystal Reports prior to version 5.0, all text-based objects are bound to lines.

The screen shots above are from Crystal Reports version 8.5. The image on the left shows the Detail section with no objects inserted and a default line height of 12 points. When a database field is first placed on the report (center image), the line’s height does not change because it is the default line height (12 points). If the text-based object’s font size is increased from 12 to 16 points, the actual height of the object (boundary) increases.
If the line height increases to accommodate the larger text-based object, then the base lines of the two dissimilar font sizes will print on different lines. This is seen in the image on the right. If a second text-based object is placed on the same line as the larger 12-point object and the smaller font object’s height (boundary) matches that of the larger font, the baselines of the two dissimilar font sizes will match, thus printing on the same line.
As other text-based objects are added to the report, either by adding lines to the same section or by placing them in other sections, the vertical spacing or interline spacing, while controlled by Crystal Reports, is determined by the printer driver. Remember, the text metrics of a font determine interline spacing. This functionality makes it difficult to create reports designed to print on preprinted forms if the printer driver is going to change. For example, totals that used to print in the middle of a box might now print below the box because the new printer driver applies a greater value to interline spacing. Line by line, the text in the report will move down farther than when the report was first created.
Friday, January 4, 2013
Split Text in Crystal Reports
We have the below text.
"IFR - Issued For Review"
Need to split the text from "-" and display only "IFR" in the report.
To achieve this add a new Formula Field to the report and add the below formula.
split({dtSquadCheckDetails.RevisionStatus},"-")[1]
You need to change the "dtSquadCheckDetails.RevisionStatus" part according to your report.
dtSquadCheckDetails - Is the data set bind to the report.
RevisionStatus - Is the column containing the text to be split.
Now you can drag and drop the Formula Field into you'r report.
"IFR - Issued For Review"
Need to split the text from "-" and display only "IFR" in the report.
To achieve this add a new Formula Field to the report and add the below formula.
split({dtSquadCheckDetails.RevisionStatus},"-")[1]
You need to change the "dtSquadCheckDetails.RevisionStatus" part according to your report.
dtSquadCheckDetails - Is the data set bind to the report.
RevisionStatus - Is the column containing the text to be split.
Now you can drag and drop the Formula Field into you'r report.
Saturday, December 15, 2012
Generate a Report from Multiple Databases in ASP.NET
Recently I had a requirement to generate a crystal report from data which retrieved from multiple databases.
What I did was, wrote a method which change the connection string dynamically and retrieve a dataset from each database and finally Merge the data tables using MERGE() method.
Once you have a final dataset with the data from multiple databases then you can perform the other operations like sorting, searching, and get unique records using below datatable properties.
datatable1.Merge(datatable2);
Merge data tables
datatable1.Sort = "sortExpression";
Sort data table
datatable1.DefaultView.ToTable(true);Get unique records
Finally, you can generate a crystal report from the datatable you have generated. You can find a post describing how to bind a datatable to a crystal report here.
What I did was, wrote a method which change the connection string dynamically and retrieve a dataset from each database and finally Merge the data tables using MERGE() method.
Once you have a final dataset with the data from multiple databases then you can perform the other operations like sorting, searching, and get unique records using below datatable properties.
datatable1.Merge(datatable2);
Merge data tables
datatable1.Sort = "sortExpression";
Sort data table
datatable1.DefaultView.ToTable(true);Get unique records
Finally, you can generate a crystal report from the datatable you have generated. You can find a post describing how to bind a datatable to a crystal report here.
Friday, December 14, 2012
Crystal Report Issue with IIS - ( bobj is undefined , Crystal report not displaying )
Some time ago i had a issue with crystal reports which is the report is not displaying and a javaScript error is shown "bobj is undefined" following the below steps solved the issue.
1. You need to use Web Application Project,No Website Project because Web App will combine DLL to project also.
2. Copy C:\inetpub\wwwroot\aspnet_client\system_web\4_0_30319\crystalreportviewers13 (you'll got it when you install -CRforVS_redist_install_32bit_13_0.exe) To your project such as (ProjectName/crystalreportviewers13)
3. copy this below to your web.config
3.1
<configSections>
1. You need to use Web Application Project,No Website Project because Web App will combine DLL to project also.
2. Copy C:\inetpub\wwwroot\aspnet_client\system_web\4_0_30319\crystalreportviewers13 (you'll got it when you install -CRforVS_redist_install_32bit_13_0.exe) To your project such as (ProjectName/crystalreportviewers13)
3. copy this below to your web.config
3.1
<configSections>
<sectionGroup name="businessObjects">
<sectionGroup name="crystalReports">
<section name="rptBuildProvider" type="CrystalDecisions.Shared.RptBuildProviderHandler, CrystalDecisions.Shared, Version=13.0.2000.0, Culture=neutral, PublicKeyToken=692fbea5521e1304, Custom=null" />
<section name="crystalReportViewer" type="System.Configuration.NameValueSectionHandler" />
</sectionGroup>
</sectionGroup>
</configSections>
3.2
<businessObjects>
<sectionGroup name="crystalReports">
<section name="rptBuildProvider" type="CrystalDecisions.Shared.RptBuildProviderHandler, CrystalDecisions.Shared, Version=13.0.2000.0, Culture=neutral, PublicKeyToken=692fbea5521e1304, Custom=null" />
<section name="crystalReportViewer" type="System.Configuration.NameValueSectionHandler" />
</sectionGroup>
</sectionGroup>
</configSections>
3.2
<businessObjects>
<crystalReports>
<rptBuildProvider>
<add embedRptInResource="true" />
</rptBuildProvider>
<crystalReportViewer>
<add key="ResourceUri" value="/crystalreportviewers13" />
</crystalReportViewer>
</crystalReports>
</businessObjects>
<rptBuildProvider>
<add embedRptInResource="true" />
</rptBuildProvider>
<crystalReportViewer>
<add key="ResourceUri" value="/crystalreportviewers13" />
</crystalReportViewer>
</crystalReports>
</businessObjects>
Thursday, November 15, 2012
Crystal Report DataBinding with ASP.NET - Simple Example

Following Tutorial describes simple data binding for a crystal report.
Step 1
Create your data source. Below is a sample datasource for bind to the report
private DataTable GetDatatable()
{
DataTable DT = new DataTable();
DT.Columns.Add("ID", typeof(Int32));
DT.Columns.Add("Name", typeof(string));
DT.Columns.Add("Country", typeof(string));
DT.Rows.Add(1, "chamara", "sri lanaka");
DT.Rows.Add(2, "Ajith", "India");
DT.Rows.Add(3, "Sam", "America");
return DT;
}
Step 2
Add a new dataset and name it as DataSetReport.
Step 3
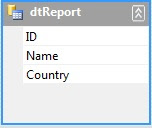
Right click on the dataset design view-> Add new datatable
Design the dataset as follows.
Step 4
Now Add a new crystal report. Right click on the Database fields and select database expert

Step 5
Under ProjectData select the dataset you have just created and click on the arrow to add it to the selected tables.

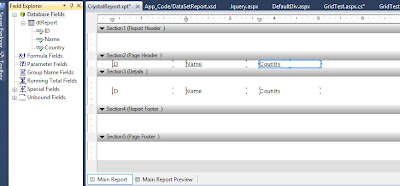
Step 6
Design your report.
Step 7
Now add a CrystalReportReportViwer Control to your .aspx page and add the following source code.
protected void Page_Load(object sender, EventArgs e)
{
LoadReport();
}
private void LoadReport()
{
ReportDocument crystalReport = new ReportDocument();
crystalReport.Load(Server.MapPath("~/CrystalReport.rpt"));
crystalReport.Database.Tables["dtReport"].SetDataSource(GetDatatable());
CrystalReportViewer1.ReportSource = crystalReport;
}
Step 8
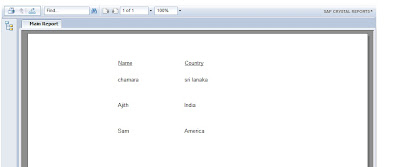
Run your .aspx page and see the report
Step 1
Create your data source. Below is a sample datasource for bind to the report
private DataTable GetDatatable()
{
DataTable DT = new DataTable();
DT.Columns.Add("ID", typeof(Int32));
DT.Columns.Add("Name", typeof(string));
DT.Columns.Add("Country", typeof(string));
DT.Rows.Add(1, "chamara", "sri lanaka");
DT.Rows.Add(2, "Ajith", "India");
DT.Rows.Add(3, "Sam", "America");
return DT;
}
Step 2
Add a new dataset and name it as DataSetReport.

Step 3
Right click on the dataset design view-> Add new datatable
Design the dataset as follows.

Step 4
Now Add a new crystal report. Right click on the Database fields and select database expert

Step 5
Under ProjectData select the dataset you have just created and click on the arrow to add it to the selected tables.

Step 6
Design your report.

Step 7
Now add a CrystalReportReportViwer Control to your .aspx page and add the following source code.
protected void Page_Load(object sender, EventArgs e)
{
LoadReport();
}
private void LoadReport()
{
ReportDocument crystalReport = new ReportDocument();
crystalReport.Load(Server.MapPath("~/CrystalReport.rpt"));
crystalReport.Database.Tables["dtReport"].SetDataSource(GetDatatable());
CrystalReportViewer1.ReportSource = crystalReport;
}
Step 8
Run your .aspx page and see the report


 Posts
Posts

